Driving Insights Dashboard
Gamifying CMT telematics to provide drivers a performance score and encourage safe driving behaviors
Overview
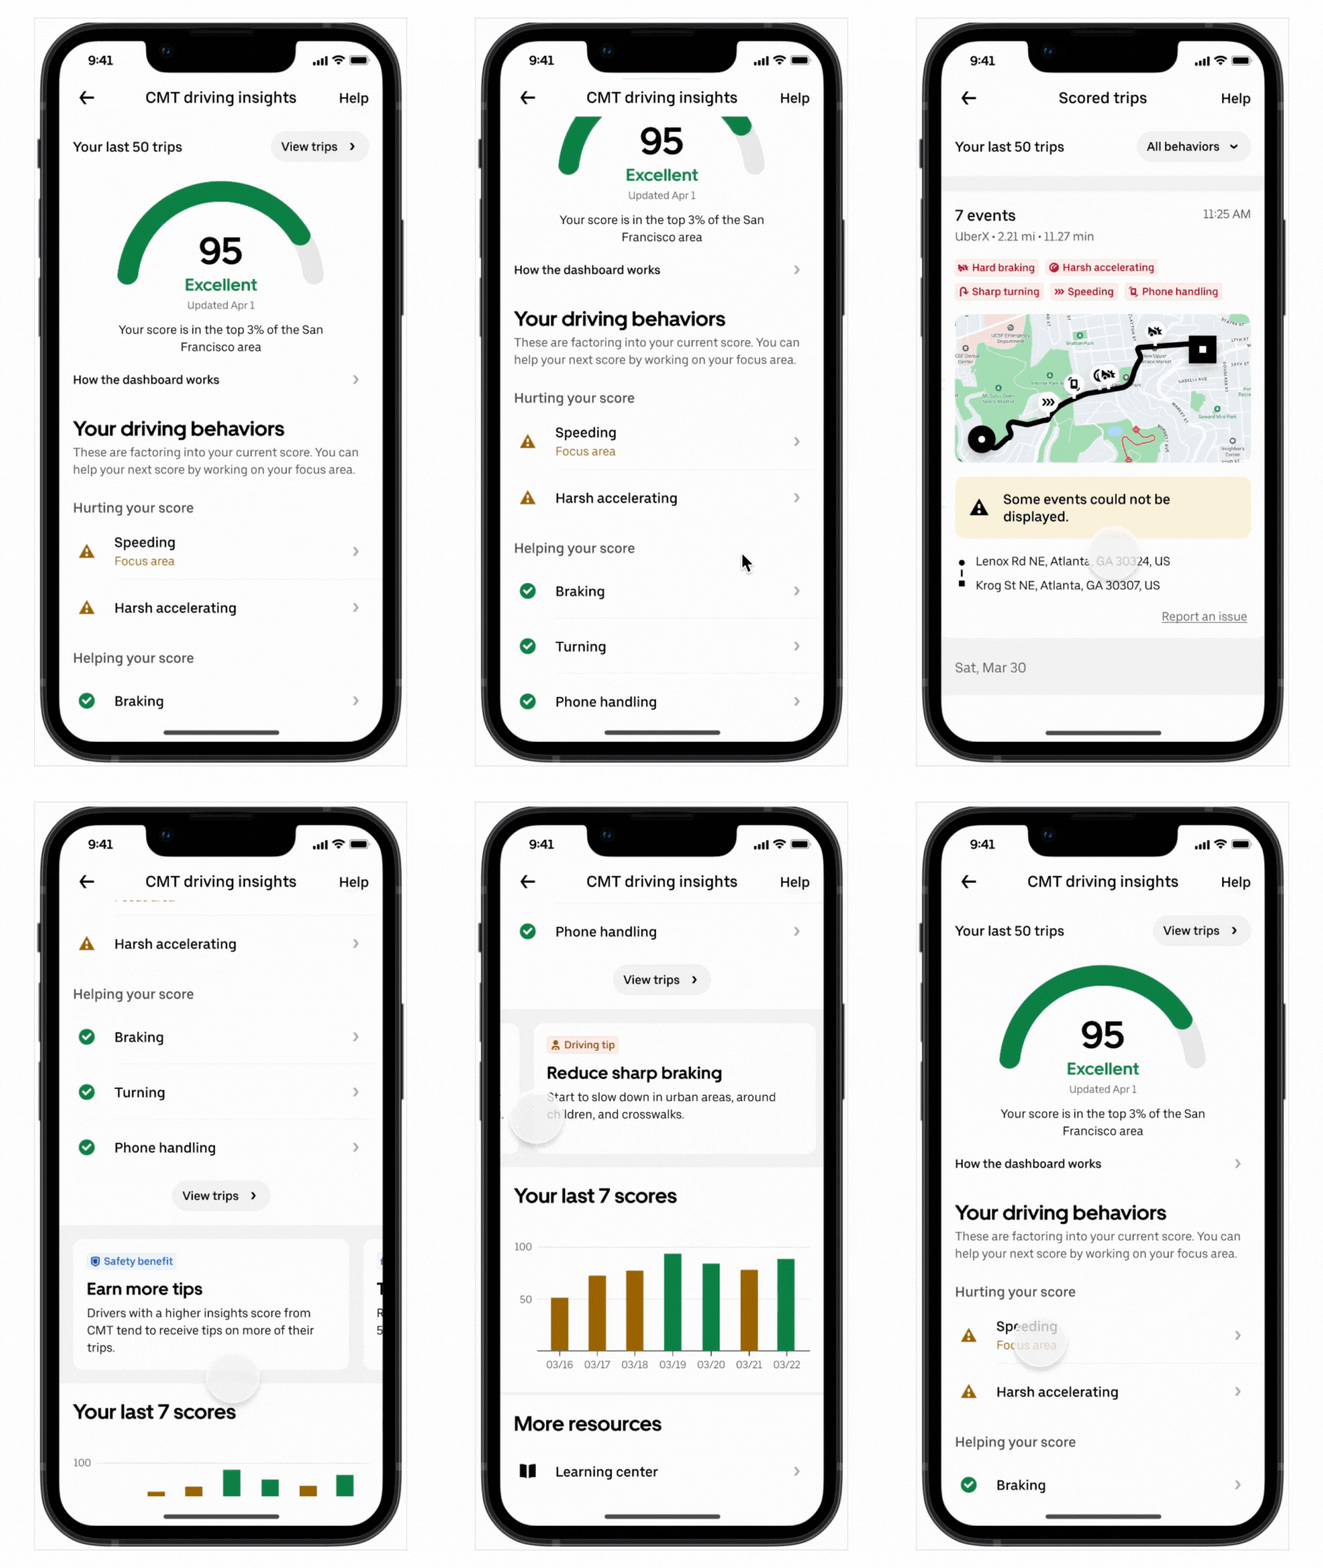
The Driving Insights Dashboard addresses a critical need: helping drivers become more aware of and improve driving behaviors that increase risk of accidents. The new dashboard provides a cumulative score based on factors like speeding, harsh braking, and phone handling, motivating drivers to adopt safer habits. In addition to the score, it highlights behaviors that positively or negatively impact safety and offers detailed daily performance summaries.
This redesign introduces gamified elements such as a cumulative score with a color coded progress arc, to create an engaging, goal-oriented experience. I led the UX research for this project, conducting a competitive analysis and usability testing with two cohorts to refine the design. The result? A dashboard that drivers find intuitive, informative, and motivating.
Problem
Modern driving habits often include unsafe behaviors that drivers may not even be aware of, such as speeding, harsh braking, or phone handling. These behaviors can significantly increase the risk of accidents, yet many drivers lack the necessary feedback to correct them. The previous iteration of the dashboard provided drivers with speeding insights but failed to offer a comprehensive view of their overall driving habits. To truly encourage improved driving behavior, we needed a more engaging and informative tool.
Goal
To create a more effective, user-friendly dashboard that can provide drivers with a clear, cumulative score based on various driving behaviors, provided by Cambridge Mobile Telematics. The dashboard will help drivers understand how their actions positively or negatively affect their overall safety, empowering them to make better choices on the road.
Solution
The new Driving Insights Dashboard presents a gamified score that offers a holistic view of a driver's performance using CMT Telematics. In addition to highlighting behaviors like speeding, harsh braking, and phone handling, the dashboard shows:
Cumulative Score: A single score based on multiple driving behaviors.
Impact Insights: Positive and negative driving behaviors that have impacted the score.
Drive History: Detailed views of daily driving performance, providing feedback on individual trips.
This gamified experience engages drivers by turning safe driving into a challenge, encouraging them to aim for high scores and adopt safer habits.
Role
Lead Researcher
Tools
UserTesting.com, Figma, Google Sheets, Google Slides
Team
Product Design, Content Design, Product Manager, Engineer
Duration
August 2023 - July 2024
Research
Research from the first iteration of the Driving Insights provided key improvements for the new iteration of the Driving Insights dashboard.
Key findings
Users responded well to gamification elements like scoring and ranking.
Clear, digestible insights were critical; too much data overwhelmed users.
Drivers appreciated feedback on areas they could improve but found complex data difficult to interpret.
From here, we identified the key improvement areas for the Dashboard
A cumulative score across multiple behaviors.
Simple and intuitive visuals that quickly convey performance.
Clear insights that provide actionable feedback.
Peer analysis
I then conducted a peer analysis to explore how other driver performance dashboards and apps approached behavior feedback. We studied a range of solutions, including telematics apps from insurance providers and vehicle-integrated safety systems.
Peer analysis key findings
100% of reviewed apps offer an in depth view of driving behaviors
75% of apps in the space use a progress arc display with a numerical score
75% use color to communicate score strength
60% have a reward for high scores
Testing
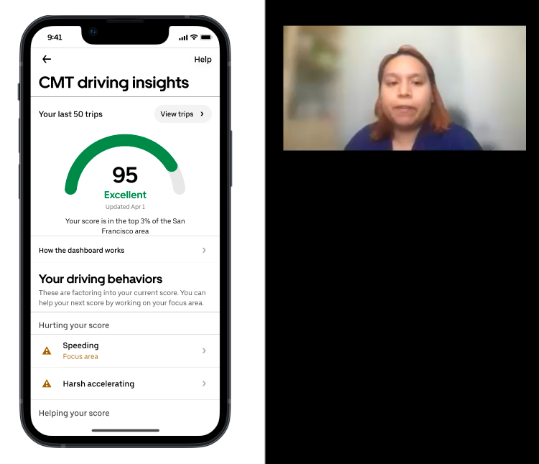
We launched the new Driving Insights Dashboard to a small treatment group! After some time, I conducted a usability test with 11 drivers across two cohorts to validate our design. One group of drivers had only used the old dashboard, while the treatment group had already experienced the new Driving Insights Dashboard.
Objectives:
Understand what drivers think of the new Driving Insights Dashboard. Determine if the new design is easier to understand.
Gain insights to how drivers navigate and engage with the dashboard
Identify opportunities for improvement
Understand if the dashboard encourages behavior change
Key Insights:
Drivers like the new design. Drivers appreciate the cumulative score and progress bar for a quick view of their driving behavior.
The Driving Insights Dashboard is easy to understand. Participants in both cohorts understand how to read the new dashboard, the score, and what factors are used to create the score.
Trust in telematics data varies. Some participants mistrust telematics data either because they don’t understand it or they don’t believe it has the ability to accurately read events.
Designing the Product
Based on the research insights the new Driving Insights Dashboard started to take shape. These design elements were important to help drivers get a quick snapshot of their performance and easily understand feedback.
Design elements include:
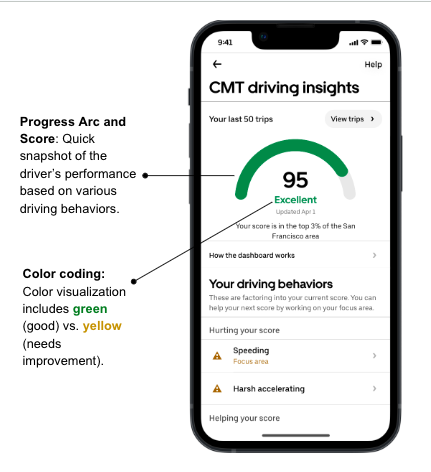
Progress arc to visualize the driver’s score on a scale 1-100
Color code to simplify drivers’ understanding of their score with green (good) vs. yellow (needs improvement).
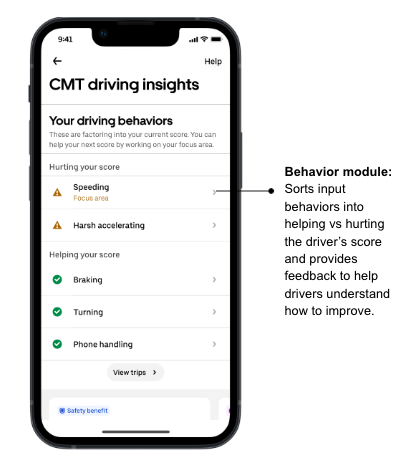
A module with the 5 input behaviors showing more in depth information such as helping your score vs hurting your score with personalized feedback.
Conducted usability test with 2 cohorts of drivers


